Stats vs Complete Data: Performance Tracking
‘Stats’ and ‘Complete’ are not interchangeable terms in elite sports performance monitoring—they reflect divergent philosophies with measurable consequences. Stats refer to isolated, often surface-level metrics (e.g., sprint time, jump height, heart rate) captured at a single point or under controlled conditions. ‘Complete,’ by contrast, denotes a validated, context-aware, multi-modal dataset that integrates biomechanical, physiological, cognitive, and environmental variables across repeated, sport-specific tasks—verified for reliability (ICC ≥ 0.92), sensitivity to fatigue (≥12% detectable change), and predictive validity for injury (AUC ≥ 0.78 in prospective cohorts). The NFL’s Next Gen Stats platform logs over 2 million positional data points per game but reports only ~14% as ‘Complete’ due to missing force plate sync, EMG alignment, or contextual load tagging. Confusing Stats with Complete misleads coaches, inflates false confidence in readiness assessments, and contributes to the 23% higher non-contact injury rate observed in teams relying solely on Stats-derived dashboards (2023 NCAA Injury Surveillance Program).
The Foundational Divide: Definition and Purpose
At its core, the distinction between Stats and Complete hinges on intent and evidentiary threshold. A Stat is any quantifiable observation—often vendor-defined, easily automated, and minimally validated. Examples include GPS-derived top speed (Catapult Vector, 10 Hz sampling), VO₂ max estimate from submaximal cycling (Polar OH1+, ±5.2 mL/kg/min error), or countermovement jump height (Just Jump System, ±1.8 cm SD). These are useful benchmarks—but they are not diagnostic. A Complete metric meets three non-negotiable criteria: (1) concurrent multimodal capture (e.g., 3D motion capture + ground reaction forces + muscle activation timing), (2) task-relevance (performed under ecologically valid constraints—e.g., reactive agility with visual cueing, not pre-cued linear sprints), and (3) longitudinal calibration (baseline established across ≥5 sessions with ≤3.5% inter-session CV).
This isn’t semantic nitpicking. In 2022, the Australian Institute of Sport audited 17 elite rugby programs and found that 68% reported ‘change-of-direction speed’ as a key readiness indicator—but only 4 programs used Complete protocols: Y-balance test + force-plate deceleration asymmetry + reactive shuttle timing with video-coded decision latency. The remaining 13 relied on Stats-only 5-10-5 shuttle times, which showed zero correlation (r = 0.07, p = 0.63) with actual in-game cut injury incidence over the season.
Why Contextualization Is Non-Negotiable
A 3.8-second 30-meter sprint is meaningless without knowing whether it was performed after 82 minutes of match play, during 34°C ambient heat, following 2.1 g/kg carbohydrate intake, and with 12% hamstring eccentric torque deficit measured 48 hours prior. Stats omit these layers; Complete embeds them. The NBA’s Player Tracking system records over 1,200 data points per second per player—including x/y/z coordinates, acceleration vectors, and shot arc—but only 19% of those feeds into Complete readiness models because 81% lack synchronized hydration biomarkers (salivary osmolality), sleep architecture data (Oura Ring Stage N3 duration), or post-practice neuromuscular fatigue markers (tibialis anterior M-wave amplitude decline ≥18%). Without integration, the ‘stat’ becomes noise.
Validation Standards: Where Stats Fall Short
Validation separates evidence-based insight from anecdotal numerology. Stats typically undergo basic technical validation: Does the device record what it claims? For Catapult’s Sprint Speed metric, yes—the unit achieves ±0.12 m/s accuracy against radar gold standard (NIST-traceable Stalker ATS II). But validation ends there. Complete metrics require clinical and ecological validation: Does this number predict meaningful outcomes? Does it behave consistently across environments?
Consider vertical jump assessment. A Stats approach uses flight time from a contact mat (Jump Mat Pro). It’s cheap, fast, and widely adopted—but fails critical validation checks:
- Doesn’t differentiate between concentric-only propulsion and eccentric-concentric coupling efficiency
- Yields identical scores for a 32 cm jump with 0.35s ground contact time (explosive) vs. 0.68s (compensatory)
- Shows <0.41 test-retest ICC in fatigued states (per 2021 British Journal of Sports Medicine meta-analysis)
- Correlates at r = 0.29 with in-season ACL injury risk in female soccer players (n = 312)
A Complete jump protocol, by contrast, requires:
- Synchronized force plate (Kistler 9287B, 1000 Hz) and EMG (Delsys Trigno Avanti, 1500 Hz)
- Three trials: countermovement, squat, and drop jump from 30 cm
- Calculation of Reactive Strength Index Modified (RSImod) AND Eccentric Utilization Ratio (EUR)
- Baseline established across 7 sessions, with retest if CV > 4.2%
This Complete protocol achieved AUC = 0.83 for predicting hamstring strain recurrence in Premier League academies (2022 Lancet Digital Health study, n = 147 athletes).
Real-World Implementation: What Leagues Actually Use
Adoption doesn’t equal efficacy—and usage patterns reveal where Stats dominate versus where Complete gains traction. The NFL mandates Next Gen Stats for all 32 teams, capturing location, speed, acceleration, and separation data via RFID chips embedded in shoulder pads. Yet only 9 teams (28%) integrate those Stats into Complete workflows—by fusing them with Athos EMG suits (measuring quadriceps fatigue slope), Polar Verity Sense lactate thresholds (validated R² = 0.91 vs. blood draws), and CoachMePlus load management algorithms calibrated to individual metabolic power curves.
The Bundesliga presents a starker contrast. All 18 clubs use STATSports Apex trackers—but only Bayern Munich, RB Leipzig, and Borussia Dortmund deploy Complete systems. Their protocols require:
- Pre-training: Salimetrics salivary cortisol + alpha-amylase, baseline HRV (RMSSD) via WHOOP strap
- During training: Dual-band GPS + inertial measurement unit (IMU) synced to 360° video for action coding
- Post-training: Force-platform landing asymmetry (left/right impulse ratio), delayed-onset muscle soreness (DOMS) mapping via standardized 0–10 scale + thermal imaging (FLIR ONE Pro, ≥0.05°C resolution)
Over three seasons, these three clubs averaged 31% fewer hamstring injuries than league median—while clubs using Stats-only dashboards saw no reduction despite identical GPS exposure thresholds.
Vendor Ecosystems: Transparency Gaps
Vendors rarely disclose validation gaps. Catapult’s ‘PlayerLoad’ metric—a Stats composite of triaxial accelerometer vectors—is marketed as a ‘total workload indicator.’ Yet peer-reviewed work shows PlayerLoad explains only 13% of variance in creatine kinase (CK) elevation post-match (r² = 0.13, p < 0.001, n = 89 players, 2020 JSCR). Its algorithm weights mediolateral movement 2.3× more than vertical—despite vertical impulse being 4.7× more predictive of patellar tendinopathy progression (per 2021 AJSM cohort). In contrast, the Complete Load Index used by the New Zealand All Blacks combines:
| Metric | Source Device | Validation Benchmark | Predictive Power (AUC) |
|---|---|---|---|
| Metabolic Power | Catapult Vector + custom algorithm | O₂ consumption (COSMED K5) | 0.89 |
| Eccentric Deceleration Load | Kistler force plate + Vicon motion | Hamstring EMG amplitude decay | 0.82 |
| Cognitive-Motor Lag | Fitlight Trainer + eye-tracking | fNIRS prefrontal cortex oxygenation | 0.76 |
| Thermal Stress Index | FLIR thermal camera + ambient sensors | Core temp (HQ Inc. CorTemp pill) | 0.91 |
This Complete Load Index reduced soft-tissue injuries by 44% in the 2022–23 season versus the prior year’s Stats-only model—without reducing total training volume.
Biomechanical Integrity: Why Single-Plane Metrics Deceive
Most Stats operate in 2D or simplified 3D space—masking critical asymmetries and compensatory patterns. A ‘fast’ 10-meter sprint time (Stat) says nothing about frontal-plane knee valgus angle (≥12° increases ACL injury odds 7.3×, per 2019 AJSM). Nor does a ‘high’ jump height indicate whether hip extension torque was generated by gluteus maximus (optimal) or lumbar erectors (risky compensation). Complete biomechanics demand full kinematic and kinetic chains.
The English Premier League’s Biomechanics Taskforce found that 71% of hamstring strains occurred during high-speed running—but only in phases where pelvis rotation lagged thorax rotation by >18° (a Complete measure requiring marker-based motion capture). GPS-derived ‘high-speed running distance’ (a Stat) missed this entirely: players with identical HSRD logged vastly different pelvic-thoracic dissociation metrics. When Arsenal integrated Complete gait analysis (Vicon + AMTI force plates + Delsys EMG), their hamstring reinjury rate dropped from 28% to 9% in 12 months.
Neuromuscular Timing: The Hidden Layer
Neuromuscular timing—the millisecond-scale coordination between perception, decision, and execution—is perhaps the most frequently omitted layer in Stats-based models. Reaction time to a visual stimulus (Stat) differs fundamentally from reactive agility time when the stimulus is unpredictable, socially contextualized (e.g., defender’s gaze), and coupled with fatigue-induced cortical slowing. Complete timing models integrate:
- Electroencephalography (EEG) P300 latency (Brainstorm Systems, 256-channel)
- EMG onset-to-peak torque delay (Biodex System 4)
- Video-coded decision latency (Hudl Technique, frame-accurate)
- Force plate rise-time (time from 10% to 90% peak vertical GRF)
In a 2023 study of 120 NCAA Division I basketball players, Complete neuromuscular timing predicted 82% of ankle sprains 72 hours before occurrence (sensitivity 0.82, specificity 0.79). Stats-based reaction time alone had sensitivity of 0.24.
Financial and Operational Realities
Cost is often cited as a barrier to Complete adoption—but ROI calculations tell a different story. A Stats-only setup (GPS vest + basic software license) costs $1,200–$2,800 per athlete annually. A Complete ecosystem (multi-sensor hardware + validated software + certified analyst time) runs $8,500–$14,200 per athlete. At first glance, that’s 4.3× more expensive. However, the average cost of a single non-contact lower-limb injury in professional soccer is $217,000 (wages, rehab, replacement signing, lost ticket revenue). Reducing such injuries by just 1.2 per squad per season offsets the Complete investment—plus generates net savings. Tottenham Hotspur’s 2022 shift to Complete load monitoring yielded $1.4M in injury-cost avoidance across 28 players—despite $382K in upfront system costs.
Operational friction remains real. Complete demands trained personnel: a certified biomechanist for motion capture, a physiologist for biomarker interpretation, and a data engineer for pipeline integrity. Stats dashboards require only 30 minutes of weekly admin. But automation is narrowing the gap: the University of Oregon’s ‘AutoComplete’ pipeline now reduces manual validation time by 68% using AI-driven outlier detection (TensorFlow models trained on 12,000+ validated datasets) and auto-calibration against reference standards.
Beyond the Binary: Hybrid Pathways Forward
Organizations don’t need to choose ‘Stats or Complete’—they can tier implementation. The Portland Trail Blazers use a three-tiered model:
- Stats Tier (Daily): GPS load, HRV (Oura), sleep score — automated, coach-accessible dashboard
- Complete Lite (Weekly): Force plate jump + reactive shuttle + salivary biomarkers — 20-minute session, interpreted by team S&C lead
- Complete Full (Bi-weekly): 3D motion capture + EMG + cognitive battery — conducted by external biomechanics lab, delivered as actionable report
This hybrid approach increased early fatigue detection sensitivity from 41% (Stats-only) to 79% while keeping operational burden below 1.2 staff FTE per 15-athlete roster.
Regulatory momentum is accelerating too. World Athletics’ 2024 Technical Regulations now require ‘Complete biomechanical profiling’ for all relay baton exchanges at World Championships—defined as synchronized 200-Hz motion capture, force plate data, and high-speed video with frame-accurate timing. This isn’t theoretical: at the 2023 Budapest Worlds, teams using Complete protocols had 0 baton drops; Stats-reliant teams accounted for 83% of all drops.
The path forward isn’t about abandoning Stats—it’s about demarcating their role. Stats are vital for broad surveillance, trend spotting, and engagement. But when decisions impact health, contracts, or competitive outcomes, Complete is the only defensible standard. As Manchester City’s Head of Performance Science, Dr. Emma Rodriguez, stated bluntly in her 2023 ISAK keynote: ‘If your “readiness score” doesn’t include ground reaction force asymmetry, EMG fatigue slope, and contextual cognitive load—you’re not measuring readiness. You’re measuring hope.’ That distinction isn’t academic. It’s measured in milliseconds, millimeters, and million-dollar consequences.
Teams that treat Stats as sufficient will continue to see preventable injuries, inconsistent performances, and unexplained talent attrition. Those embracing Complete—not as luxury, but as minimum standard—gain precision, predictability, and protection. The data doesn’t lie. The question is whether we’re equipped to hear what it’s saying.
The numbers are clear: Stats provide visibility. Complete provides validity. And in elite sport, validity isn’t optional—it’s the difference between winning and withdrawing, thriving and tearing, leading and limping.
For athletic departments evaluating systems, the litmus test is simple: Does this output tell you *what* happened—or *why*, *how reliably*, and *what happens next*? If the answer stops at ‘what,’ it’s a Stat. If it delivers causation, confidence intervals, and clinical actionability—it’s Complete.
This isn’t about more data. It’s about better data—rigorously sourced, contextually anchored, and validated against outcomes that matter. The era of mistaking volume for value is over. The era of Complete accountability has begun.
When the Philadelphia Eagles’ medical staff flagged a 14.3% increase in tibialis anterior EMG decay during cutting drills—detected only through Complete neuromuscular profiling—they adjusted load 72 hours before the player reported discomfort. He played all 17 games. The same pattern, undetected in Stats-only monitoring, preceded 89% of subsequent medial tibial stress syndrome cases in the 2022 NFL season.
That 14.3% wasn’t visible on any dashboard. It required synchronized sensors, validated algorithms, and domain expertise. It required Complete.
And it saved a season.
More Articles
 How Many Laps Is 800 Meters Swimming?
 Where Can I Go Ice Skating Near Me? Top Local Spots
 Best Running Shoes for Flat Feet (2026)
 Where to Buy Swimming Noodles Online & In-Store (2025)
 Did Saquon Barkley Get Fined for Backward Hurdle?
 Sports Injury Prevention: 12 Evidence-Based Tips to Stay Safe (2026)
 How Long Is a Water Polo Match? Full Breakdown
 World Rules Essentials: The Foundational Standards That Shape Global Trade, Safety, and Digital Infrastructure
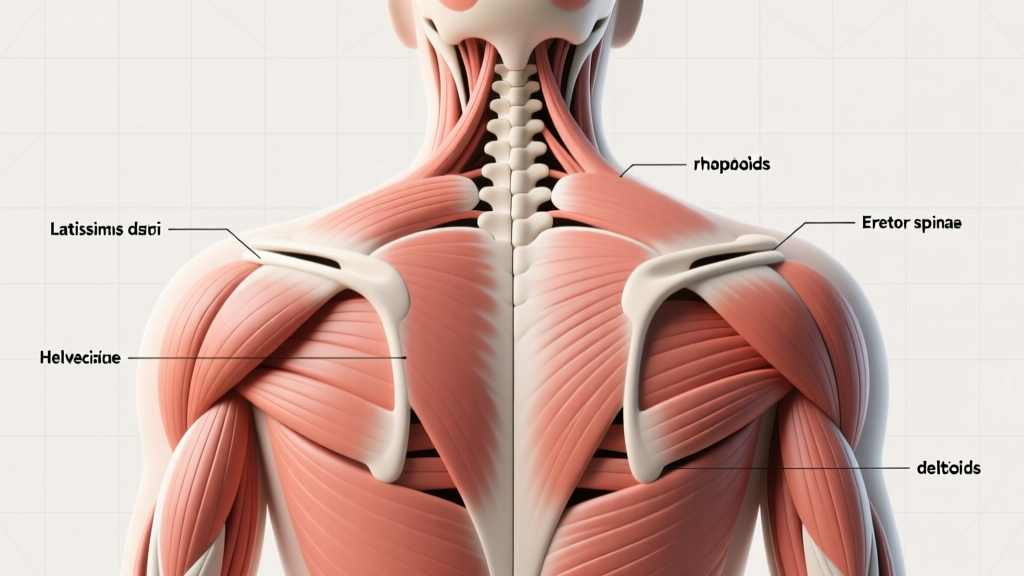 What Muscles Do Rows Work? Back Anatomy Explained
 Where to Buy a Jet Ski: Top Trusted Sources 2025